Embed today’s gamma levels
Put the four dealer-gamma levels this desk watches — call wall, put wall, gamma flip and
max pain — on your own site, in a post, or on a TradingView chart. Free, no account, no
API key, and nothing to install: one <iframe> and you are done.
What you actually get for QQQ: QQQ levels reach an embedded widget at least 30 minutes behind the market — the same reading a visitor who is not signed in gets on the site itself. The widget stamps its own “as of” time and labels itself in the corner, so whoever reads it on your page can always see how fresh the number is. Levels are derived analytics — not exchange quotes, not a live order tape — and they are education, not investment advice.
Preview
This is the real widget, not a mock-up — exactly what your visitors see. It re-checks the levels about once a minute on its own.
Copy the embed code
Paste it anywhere HTML is allowed. It carries a visible caption line linking
back here so your readers can find the full chart — please keep it. Change
ticker= to any symbol in the row above, and add &theme=light or
&theme=dark to pin the colour scheme (it follows the reader’s system
setting otherwise).
Add to a TradingView chart
A ready-to-paste Pine v5 study with QQQ’s levels baked in. In TradingView open Pine Editor, paste, and click Add to chart. Re-copy any time for fresh levels.
Pine snippet · open raw
//@version=5
indicator("VolStrata Levels — QQQ", overlay=true, max_lines_count=20, max_labels_count=20)
// VolStrata key dealer-gamma levels for QQQ — snapshot as of Sep 15, 2026 · 12:11 PM ET.
// Auto-generated at volstrata.com · re-copy any time for fresh levels. Paste into TradingView → Pine Editor → Add to chart.

grp = "VolStrata Levels"
showLabels  = input.bool(true,  "Show labels",       group=grp)
extendRight = input.bool(true,  "Extend lines right", group=grp)
lookback    = input.int(300, "Line length (bars)", minval=10, group=grp)

f_level(price, txt, col) =>
    if not na(price) and barstate.islast
        x2 = extendRight ? extend.right : extend.none
        line.new(bar_index - lookback, price, bar_index, price, color=col, width=2, extend=x2)
        if showLabels
            label.new(bar_index, price, txt + "  " + str.tostring(price), style=label.style_label_left, textcolor=col, color=color.new(col, 85), size=size.small)

f_level(703.62, "Call Wall", color.new(#ef5350, 0))
f_level(703.13, "Put Wall", color.new(#26a69a, 0))
f_level(705.77, "Gamma Flip", color.new(#f4c542, 0))
f_level(710.68, "Max Pain", color.new(#b39ddb, 0))
f_level(704.58, "Spot", color.new(#8aa0b6, 40))
Share image
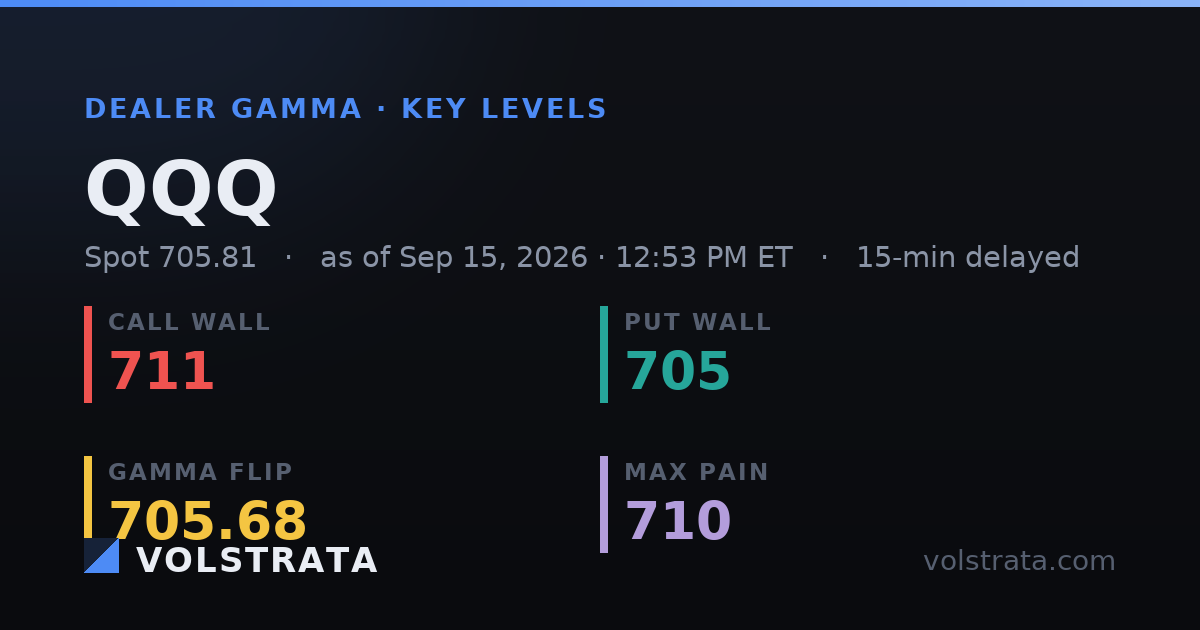
A 1200×630 social card that unfurls when the link is pasted: /og/levels/QQQ.png
Build your own — the open levels feed
If an iframe is not what you want, read the same record as JSON and render it however you like. No key, no account, and it is CORS-open so a browser can call it directly:
https://volstrata.com/embed/levels.json?ticker=QQQ · open raw
{
  "ticker": "QQQ",
  "requested_ticker": "QQQ",
  "clamped": false,
  "spot": 704.58,
  "call_wall": 703.62,
  "put_wall": 703.13,
  "flip": 705.77,
  "max_pain": 710.68,
  "regime": null,
  "net_gex_bn": null,
  "as_of_epoch": 1789488718,
  "as_of_label": "Sep 15, 2026 \u00b7 12:11 PM ET",
  "delayed": true,
  "delay_secs": 1800,
  "stale": false,
  "has_data": true,
  "source": "delayed",
  "status": "ok",
  "reason": null
}
Prices are numbers or null — never a placeholder. Read
delayed, delay_secs and stale before you print a number,
and show as_of_label beside it. Please cache for a minute or so and credit
volstrata.com where the numbers appear.
Full documentation: /levels-api — every field explained, the freshness terms measured symbol by symbol, what we ask for in return, and copy-paste examples for the command line, the browser and Python.
What do these levels mean?
Go deeper in the gamma glossary and the education library, or open the full gamma-exposure explainer.